Loss of heterozygosity during inbreeding
Published:
This beauty is Bacillus rossius a proud mum of the tiny green stick insect crawling over her. You are maybe asking, who is father? Well, it’s her brother.
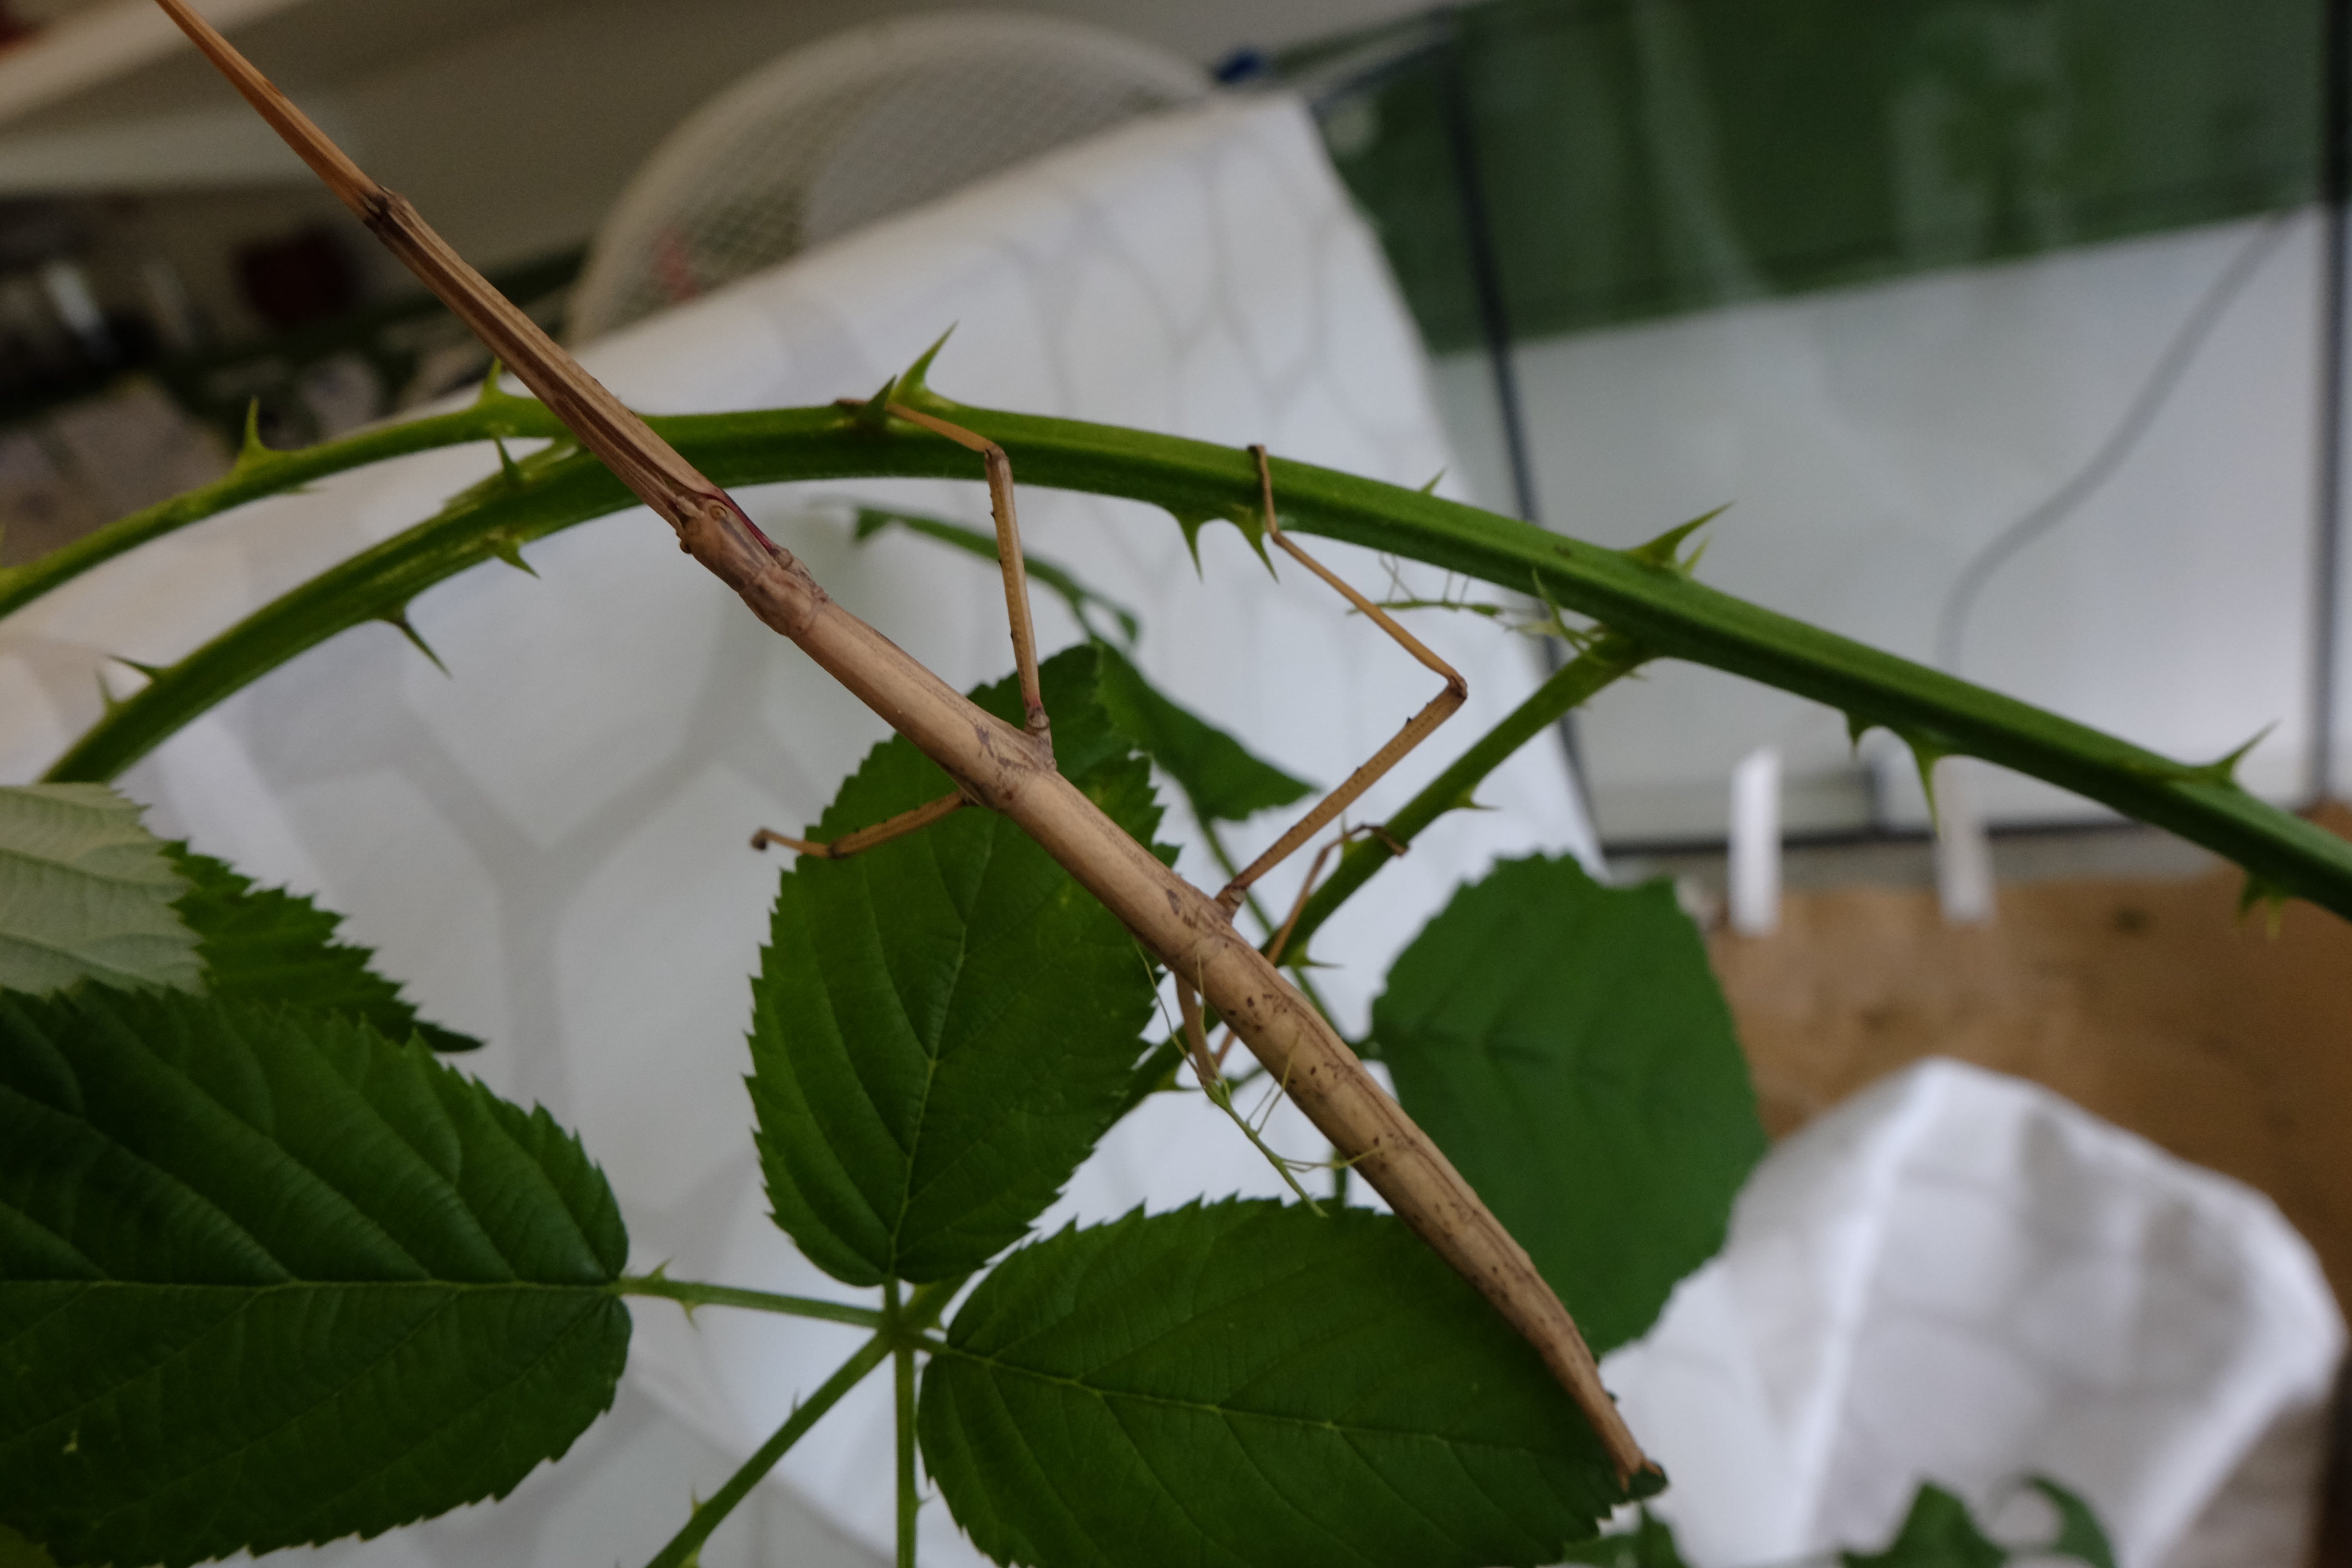
I wanted to have stick insect pets in my office. They are very friendly and low maintenance animals and one has a lot of fun with them. However having pets just for sake of having pets is kind of boring, therefore I have decided to keep at least an inbreeding line. You might wonder what kind of sick person I am when I want to have stick insect siblings mating in my office. It’s not that strange for people in genomics to keep inbreeding lines to reduce heterozygosity to negligible levels, so when the genome is sequenced it’s efficiently haploid and thus easier to assemble. I am not planning to sequence Bacillus genome, but if I ever decide to do so, I will have my fully homozygous lineage ready.
While watching stickies mate I started to wonder how much heterozygosity they lose every generation. This sounded like a problem that had to be resolved long time ago, but I could not find satisfactory answer online. The best I found is this scheme by James Mallet and Kevin Fowler, where “F = probability that two alleles in an individual are identical by descent (IBD)” :
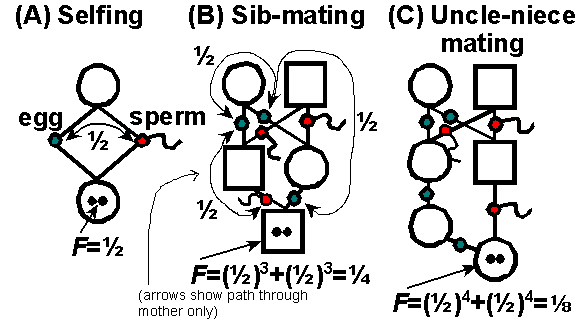
And I started to wonder, how is this supposed to work? If both siblings are heterozygous at a locus and not sharing even one allele, then it’s impossible to produce homozygous offspring. The probability can not be 0.25, F just got to be dependent on initial loci state.
Markov chain inbreeding model
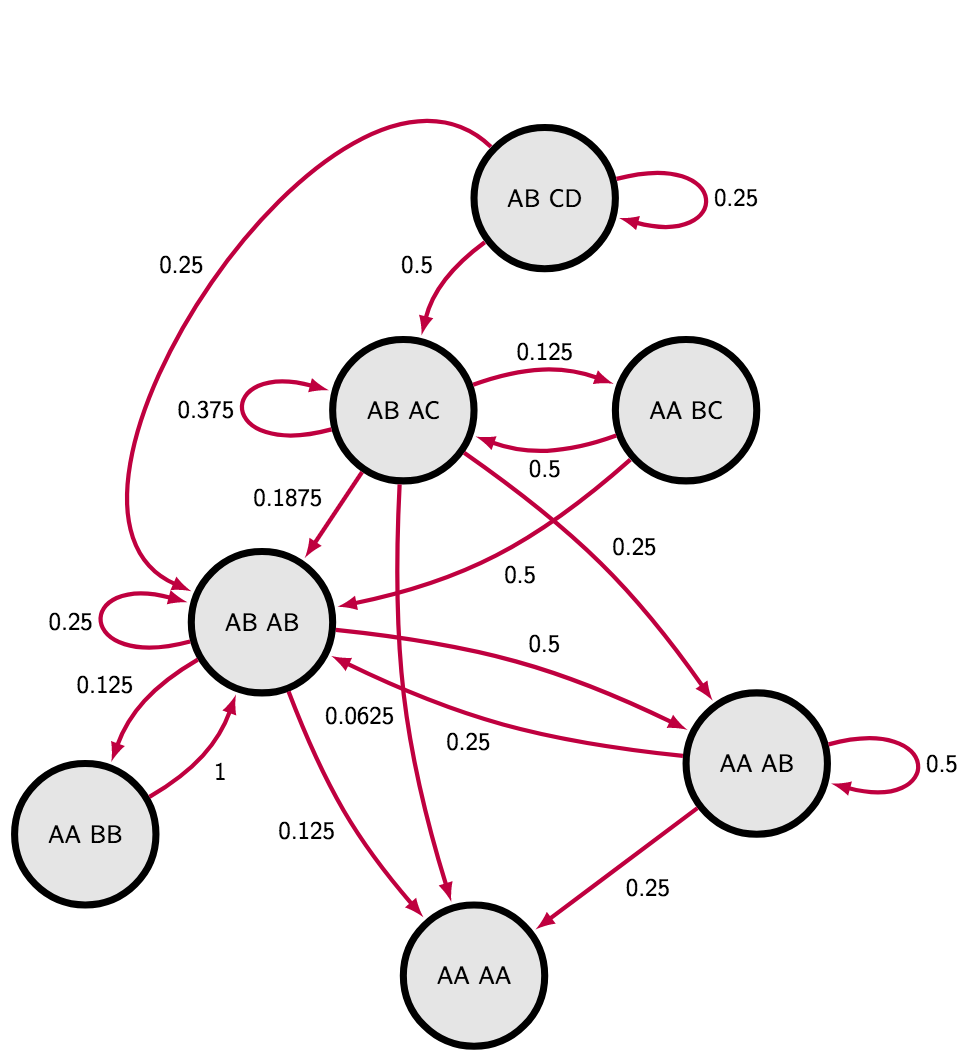
So I have decided to do my own Markov Chain to describe the situation completely. I realized that if I do not care about actual genotype, but only about heterozygosity, I do not have to explore more than seven different states. The most extreme case of four different alleles in the siblings have just one possible layout AB CD. Three allelic states can be either homozygote and heterozygote AA CD or two heterozygotes sharing an allele AB AC. Since we are not interested in exact genotype, the genotype AA CD is equivalent to genotype CC AD or AC DD, the only aspect we have to take into account is the layout of alleles among two individuals. Two allelic states have three different layouts : AA BB, AA AB and AB AB. Finally the monoallelic state is an absorb state AA AA - the one that is impossible to escape if we neglect mutations.
I calculated transition probabilities between states manually on whiteboard, you can find them in the markov chain matrix or illustrated on the following scheme. The sanity check was that sum of all outgoing transition probabilities is always one (“leaving” arrows) :
Then calculating mean time of reaching absorb state can be achieved through fundamental matrix (take a look on lines 7 - 27 in the R script), see following table
| initial state | mean number of generations |
|---|---|
| AB CD | 7.667 |
| AB AC | 6.667 |
| AA BC | 7.167 |
| AB AB | 5.667 |
| AA AB | 4.834 |
| AA BB | 6.667 |
One locus will get homozygous on average in 5 - 8 generations dependent on the initial state. I was actually surprised how high the number is, even for initial states that are very close to the homozygous state like AA AB. Have I done a mistake somewhere? If you find it, I would be grateful.
I would also like to know exact probabilities of reaching homozygous state given generation and initial state. I did not know how to do it elegantly so I have done a lot of matrix multiplication (lines 30 - 64 in the R script) and here I plotted probability of being homozygous against inbreeding generation.
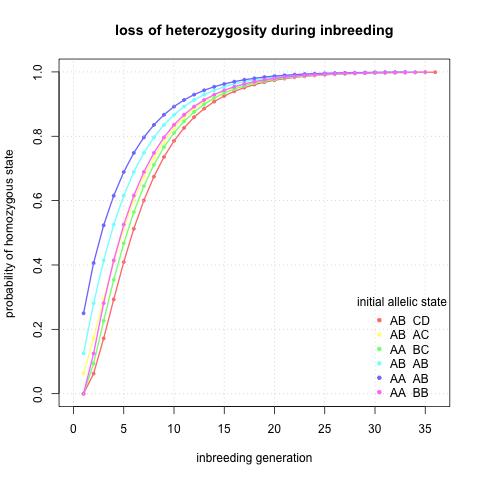
Interesting, it seems that indeed after ~10 generations I can be quite sure that a locus will be homozygous regardless of the initial state.
I was initially interested in potential sequencing of the genome. Then single locus solutions are not exactly what I am searching for. So I calculated probabilities of being fully homozygous given number of independent loci and inbreeding generation. The logic behind is that linked loci will homogenise in the very same fashion as the loci we actually calculate probabilities of. It would be reasonable to take twice the number of chromosomes, however this choice should be very much dependent on recombination rates, and those can vary several order of magnitudes between different species (look at this review if interested in recombination rates). I assumed a single type initial state AB CD and I plotted the probabilities given generation and number of loci
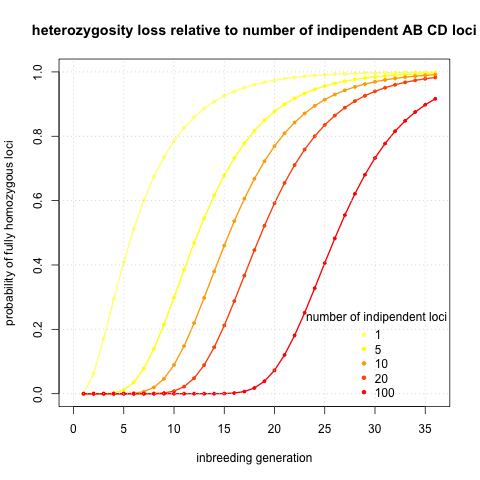
It seems that to get fully homozygous genome I will need to wait ~30 generations. That sounds annoying. I calculated also the initial case AA AB (see an analogical Figure), but it’s basically same thing shifted five generations to left.
Maybe I should figure a better way to expand analysis to multiple loci. The probability of fully homozygous genome is too much, I should probably focus on probability of at least 95% of genome homozygous or maybe directly calculate proportion of homozygous loci in genome with confidence intervals… maybe another time.
History of inbreeding studies - an update
Dear colleagues of mine, who saw my blog have pointed me into right direction. I found that I have re-discovered hundred years old concept that have been abandoned because it was not practical. Raymond Pearl wrote a series of publications between 1913 and 1917 searching for practical quantification of inbreeding in the very last one, he writes : “desirability of a single numerical measure, to supplement or replace the inbreeding curve as a designation of the total inbreeding exhibited”. Looking at the figure makes me think that inbreeding curve is exactly the concept I have rediscovered. In 1921 Sewall Wright have responded to Pearl’s series of studies. In Systems of mating he suggests “Inbreeding coefficient” as an alternative, a coefficient that is used till now.
The last publication that should be mentioned in history overview of such blogpost is “The Distribution of the Proportion of the Genome Which Is Homozygous by Descent in Inbred Individuals” by I. R. Franklin. I was not able to actually go through it, but it seems that he have resolved the problem of linkage. I promise that if I will ever try to do proper calculation of proportion of homozygous proportion of genome during inbreeding, I will confront my results with this paper.
Note that of all those people, I am the first one who made a Markov Chain to resolve inbreeding problem. One more interesting thing was for me that writing a my own model was for me WAY easier that finding a hundred years old solution to the problem.

Leave a Comment